A critical component of enhanced rock weathering (ERW) projects is quantifying carbon dioxide removal (CDR) at field scale. Carbon dioxide removal with ERW is tracked using multiple phases (gas, liquid, and soil) at InPlanet. In addition to other phases, a key component of monitoring weathering rates is done by analyzing soil samples. Combined with other measurements, determination of weathering rates in soils may be related back to carbon dioxide removal at the field scale. However, to do this suppliers like InPlanet must balance operational feasibility, cost, and data quality. This is a major challenge when determining a standard operating procedure for in-field soil sampling. For accurate field-level carbon dioxide removal (CDR) rate estimations, high spatial resolution is scientifically desirable. However, practical and affordable measurements are crucial for scalable enhanced rock weathering (ERW). Measurement techniques must balance accuracy and feasibility.
Given that soil’s chemical and physical properties may be in some cases highly spatially variable, it is necessary to determine the optimal sampling density capturing field scale heterogeneity on a case by case and site by site basis. To ensure that rigorous MRV scales alongside ERW, we are testing several project design elements that are meant to strike a balance between efficiency and accuracy such as:
- Subsampling to incorporate small scale variability into single sample points
- Sample pooling to reduce analytical costs
- Paired analysis of geolocated samples to reduce uncertainty
- Baseline rarefaction analysis to determine field scale variability and sample density needed to capture all variables
We are currently implementing and refining these approaches in a number of ongoing field deployments to ensure that all InPlanet removals meet a high level of rigor.
Statistics 101
Calculating CDR from the infield samples requires the ability to resolve differences between the baseline and post-weathering samples. This also extends to calculation of losses into biomass and into the near-field and far-field zones. To reliably compare control and treatment areas, we must determine if observed differences in these measurements are statistically significant.
The resolvability of these differences depends on:
- The magnitude of change from weathering. More weathering makes it easier to identify the change.
- Application rate impacts our ability to identify the tracers. Higher application rates increase our ability to distinguish the rock powder signal against the soil signal.
- Soil systems are inherently complex and variable. Across any single site, there might be small changes in soil properties such as texture and pH. Additionally, the rock powder is never spread perfectly evenly and will have varying mineralogy. This can lead to a noisy dataset, meaning there is lots of scatter in the measured values. Scatter decreases our ability to resolve a weathering signal.
- The number of samples collected. All things being equal, more samples will be needed to produce a statistically significant result when very little of the applied rock has weathered or there is high background heterogeneity.
Subsampling
Soil chemistry may vary at the meter scale, even for the same soil type in the same field. This small scale variability can be due to root systems, compaction from machinery, the distribution of minerals (such as clays), or topography.
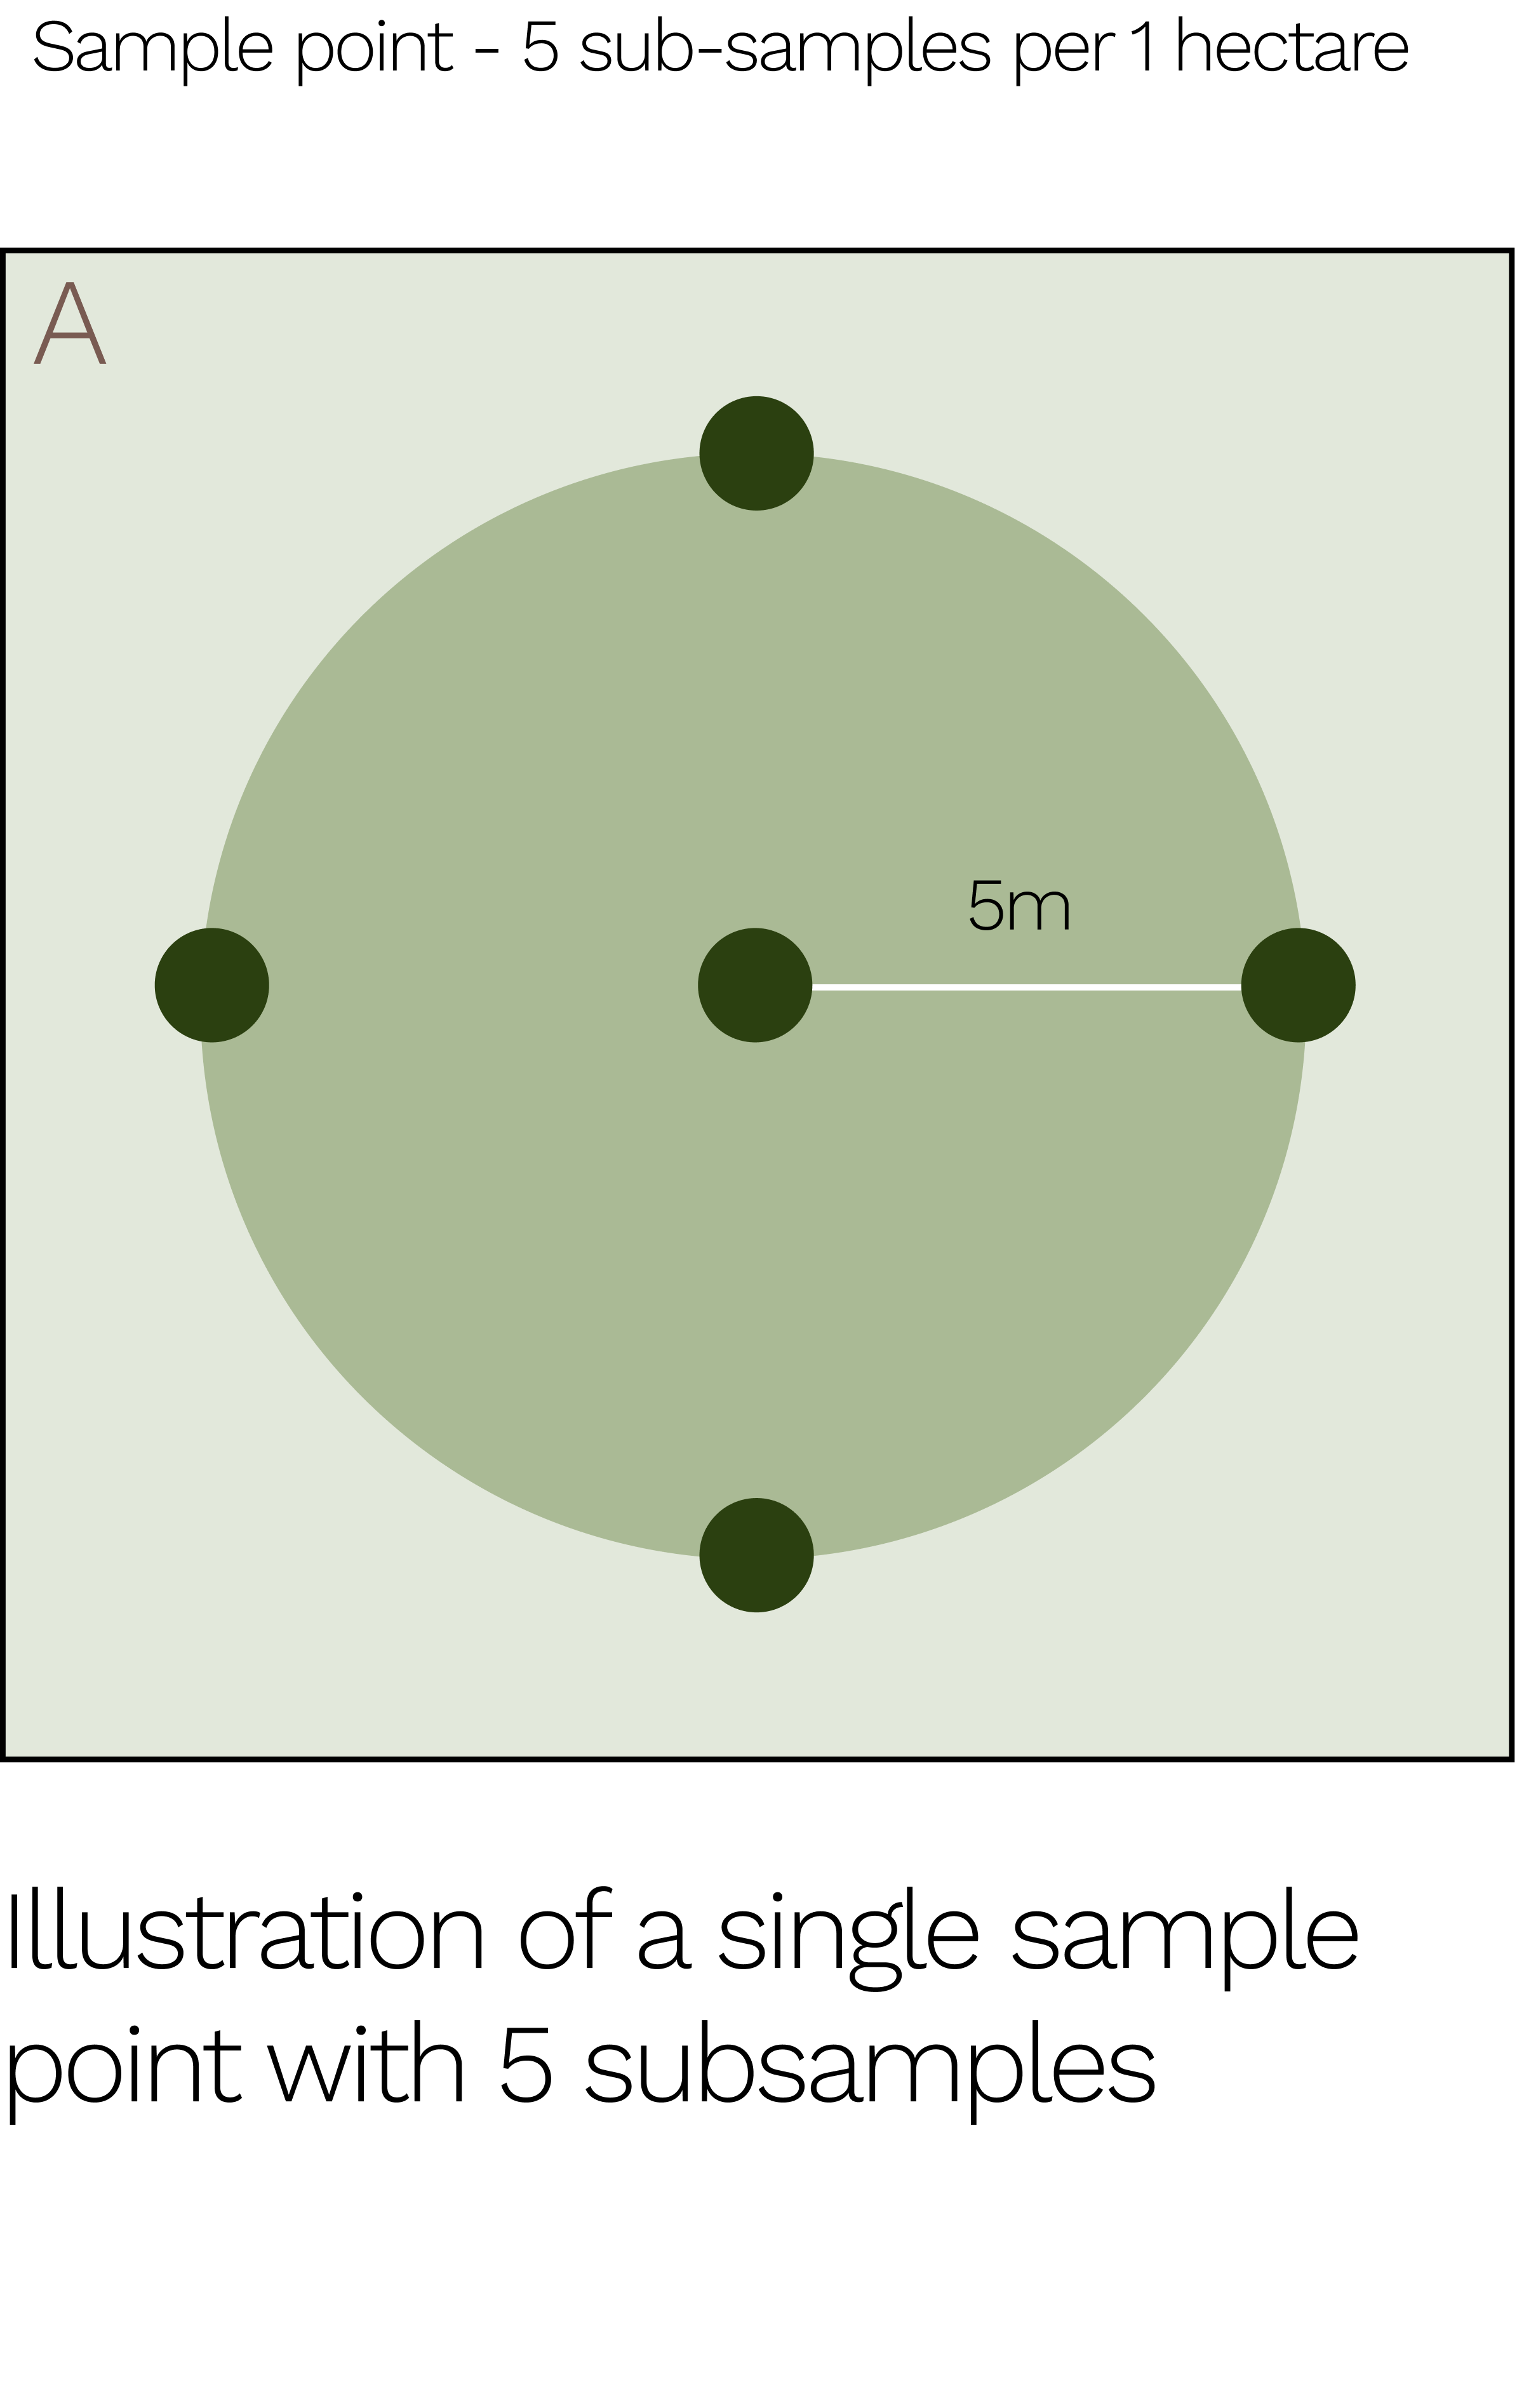
These aspects are unavoidable in a natural system. To capture all the variability in a single sample point, we use subsampling methods. This practice takes multiple subsamples within a defined area, and composites them to reduce the impact of small scale variability on the measured result. At InPlanet, we collect one central subsample with four additional subsamples arranged at 90-degree intervals on a 5-meter radius circle (Fig. 1A).
The Isometric protocol recommends taking multiple subsamples per sample point, based on analogous methods for organic carbon quantification. However, the exact number of soil subsamples that optimizes the tradeoff between signal and sampling resources is still an active area of exploration. The optimal number will likely vary depending on the magnitude of soil heterogeneity of the project.

Explaining Our Soil Sampling Methodology
Pooling
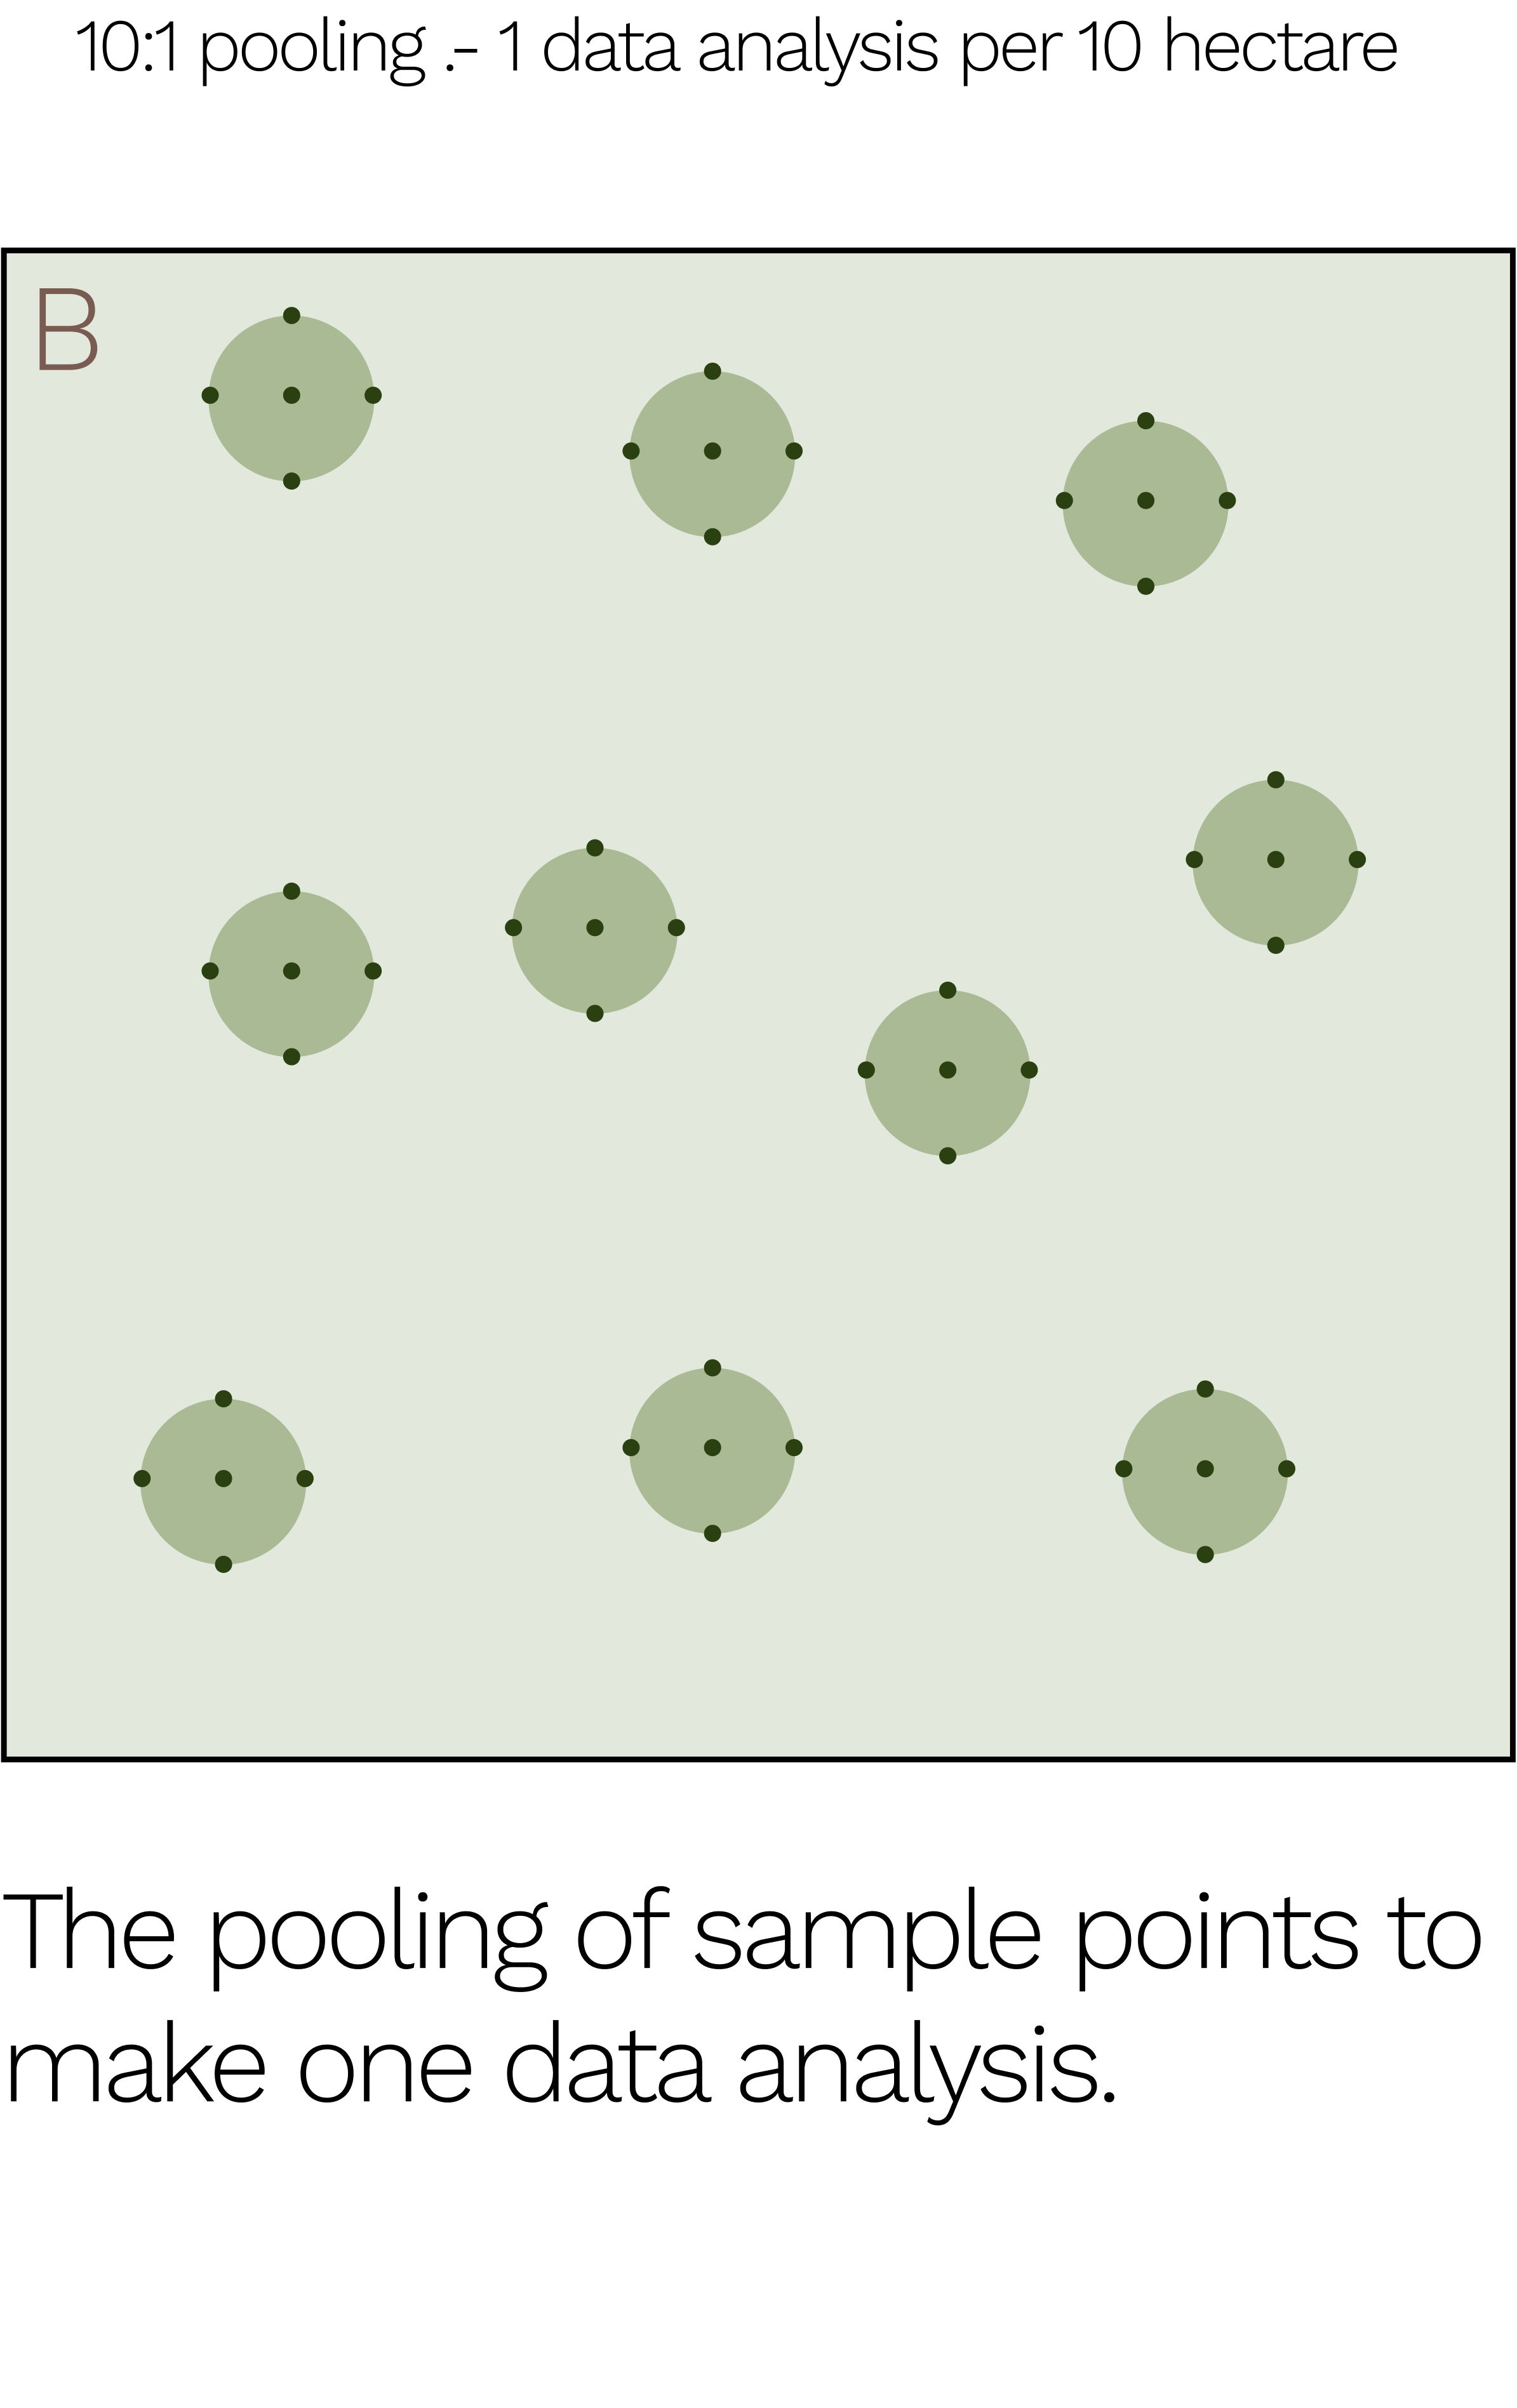
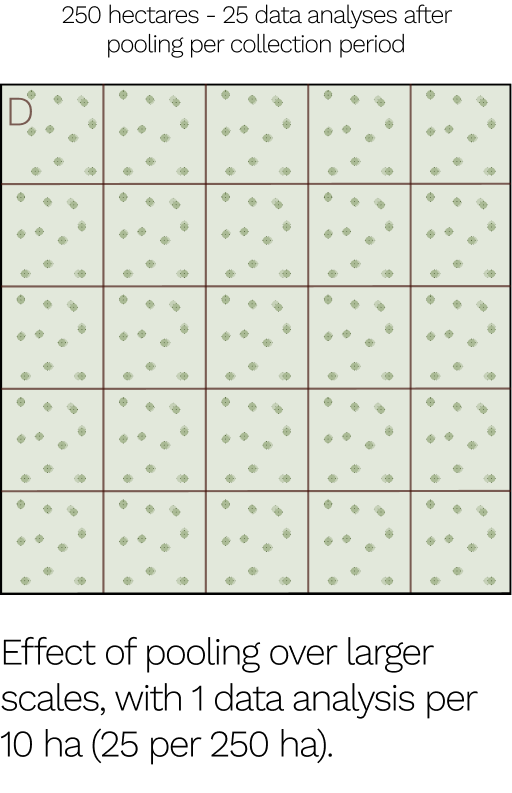
While subsampling mitigates small scale variability during sampling, sample pooling allows us to effectively take multiple sample points in a certain area and mix them together to produce a single sample for analysis, which reduces analytical costs. The Isometric protocol allows for up to 10:1 pooling, meaning that a maximum of 10 sample points (themselves made up of multiple subsamples) can be combined into a single sample for analysis (Fig. 1B). This approach leads to averaging of target parameters across the area over which the samples were collected.
There are some practical limits to this approach. Pooling decreases the number of independent data points available after analysis, which decreases the statistical power to resolve signals. Therefore, the optimal pooling plan must be determined by considering both analytical cost and signal resolvability.
Paired Analyses
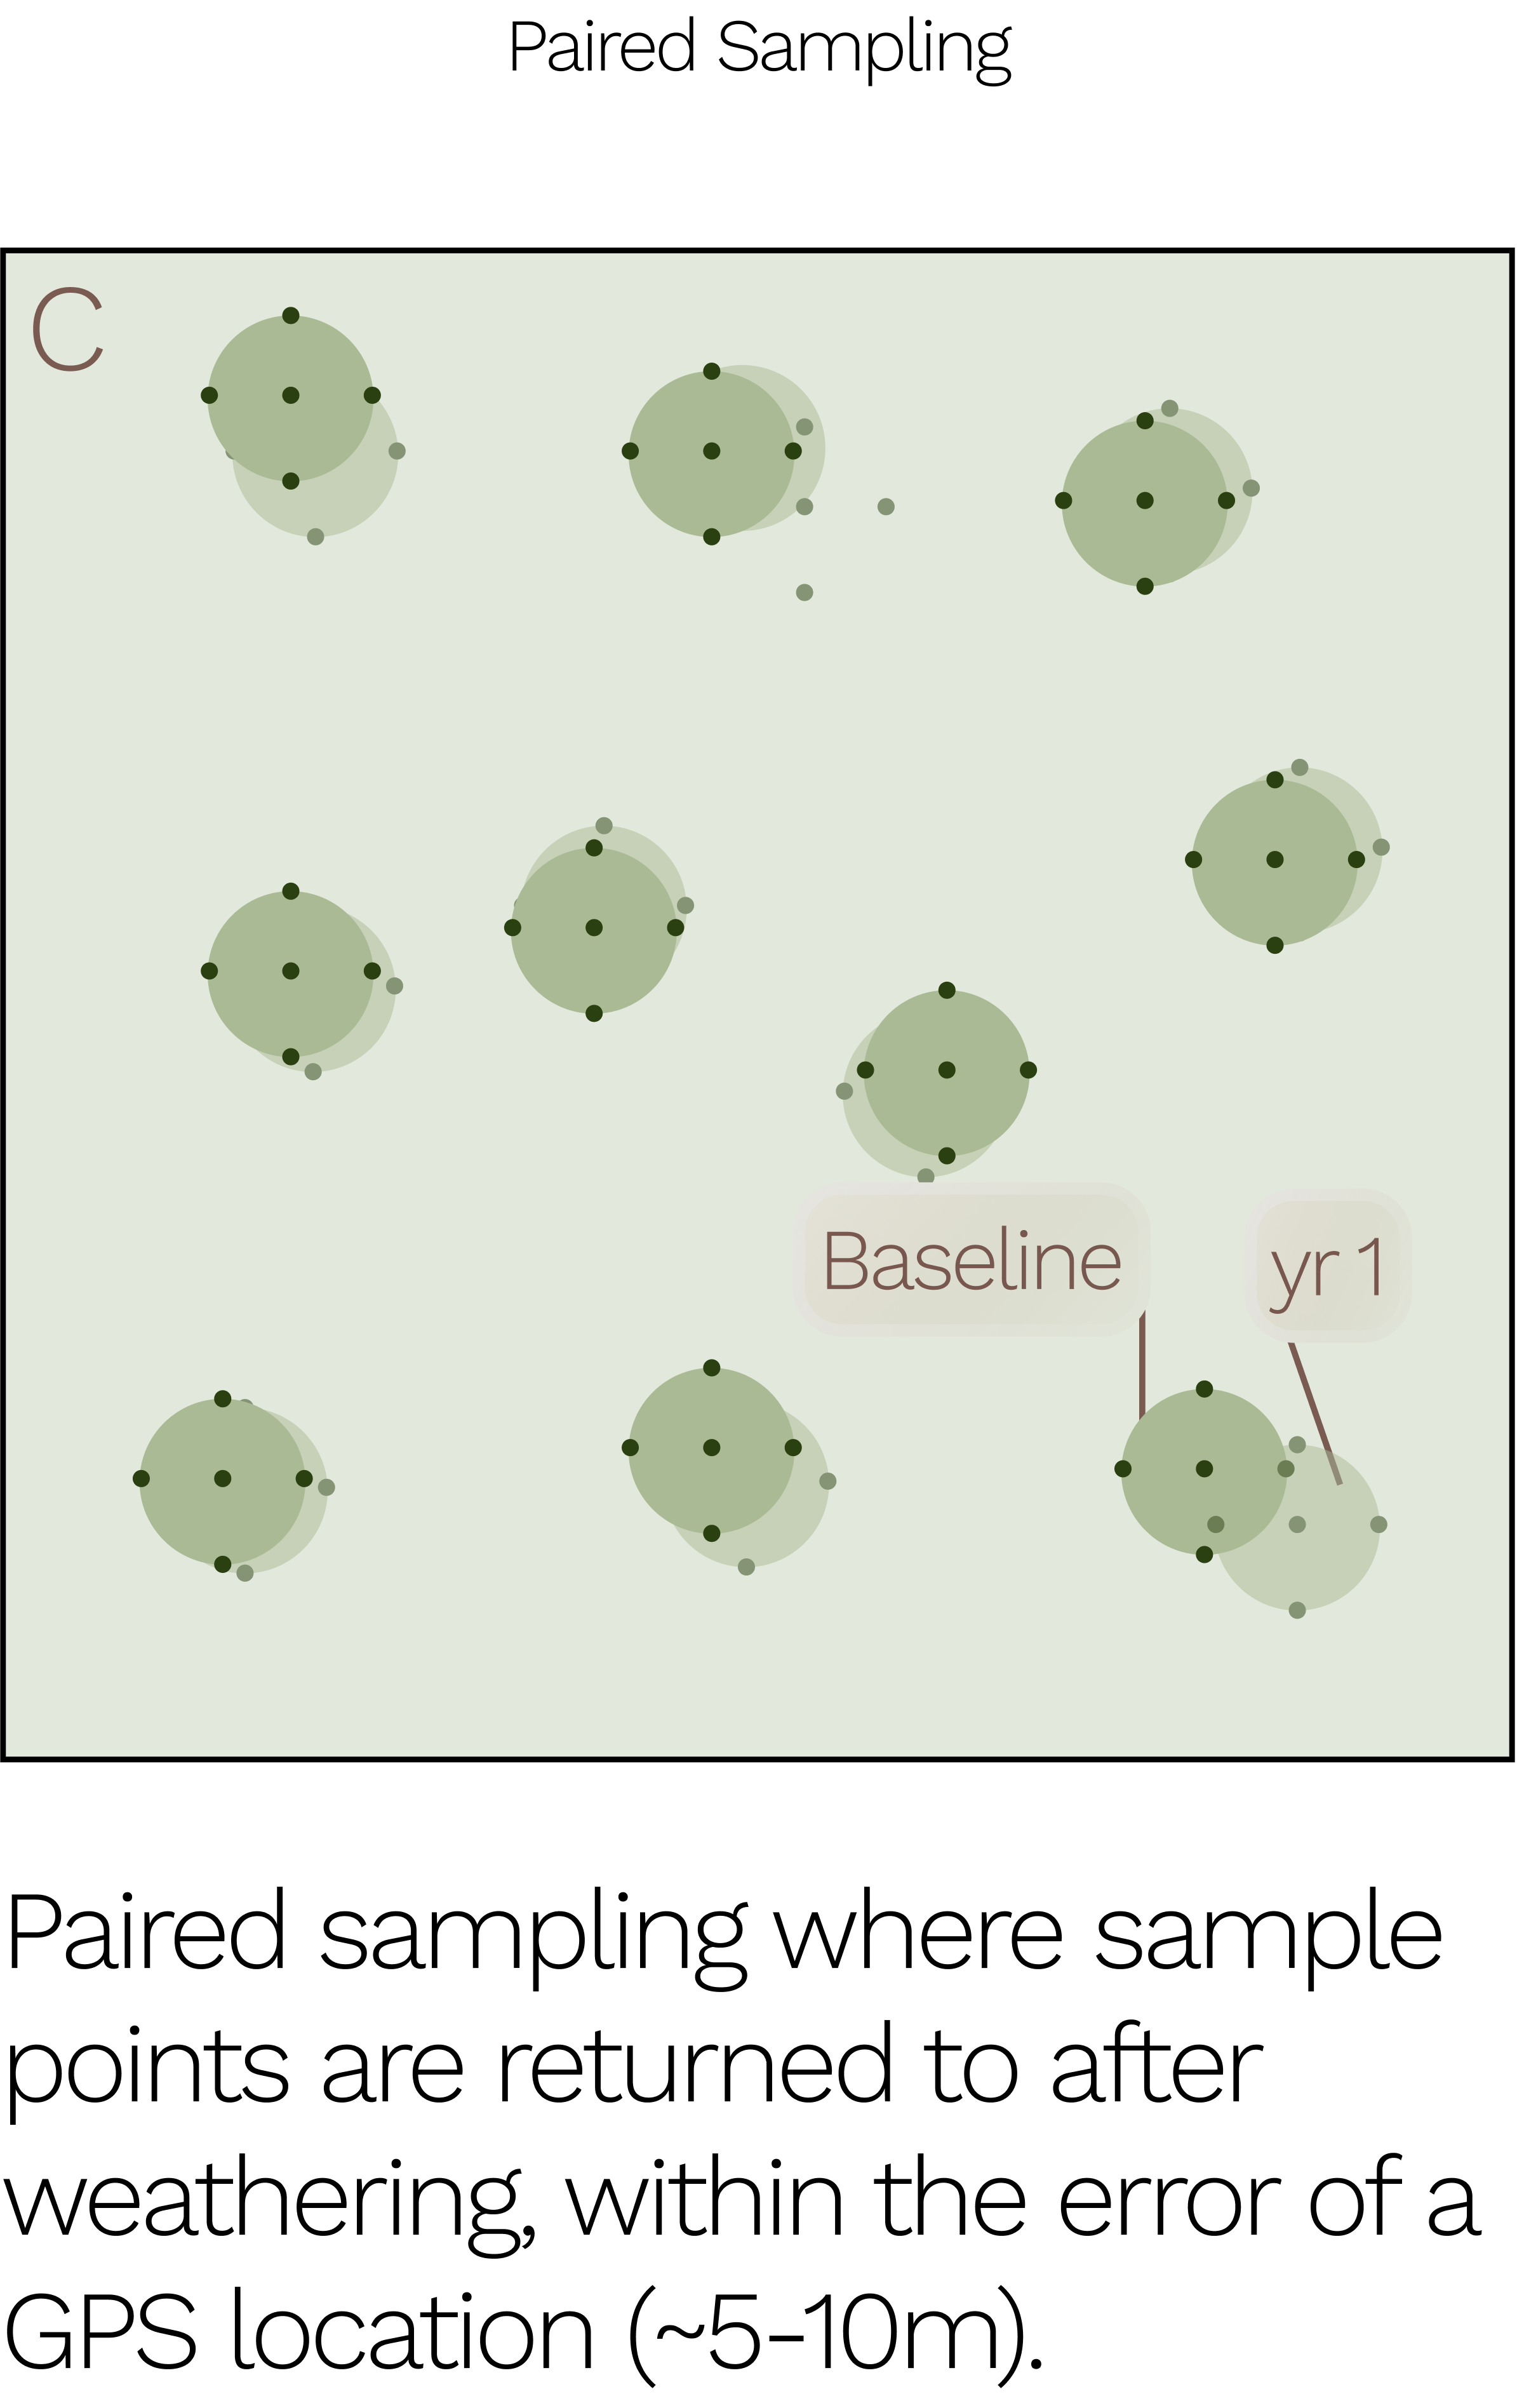
With optimal sampling density and pooling plan, we select baseline sample points using GIS-based algorithms to ensure randomness and spatial coverage. A year later, we returned to the same points to take the post weathering samples (Fig. 1C). All CDR calculations are performed using geographically paired baseline and post weathering samples, these we refer to as paired analyses. GPS accuracy is typically 5-10m, meaning that the 5 meter radius used in our subsampling scheme ensures there is generally some overlap in the subsampling area at each sampling event, helping us better mitigate any uncertainty in positioning.
Paired analysis allowed us to isolate and assess the field-level uncertainty and heterogeneity specifically related to changes in major cation and immobile tracer concentrations. This method effectively removes the confounding variability associated with absolute concentrations, enabling us to focus solely on the changes induced by feedstock application and weathering.
One alternative approach would be to take new random sample points a year later, or to treat the data as unpaired samples at the field level for the CDR calculation. This approach runs the risk of introducing noise as it discards the reality that spatial variability in soil chemistry and hydroclimate is controlling the weathering activity. With a similar rationale, research on soil organic carbon (SOC) sampling suggests that compared with random sampling, paired temporal sampling can improve estimates in SOC stock changes when sampling density is constrained [2].
Rarefaction analysis for optimal sample size
At InPlanet, we combine rarefaction analysis and GIS algorithms to determine optimal sampling density and sampling locations for each project to cover the observed variability for that specific field.
Rarefaction analysis has long been used in ecology to assess species richness and diversity as a function of sampling size. For example, if you have a box of 1000 fossils in front of you, and you want to know how many different species there are in the box, you wouldn’t want to count all 1000 of them! If you were to count the species numbers as you count the fossils, you would discover the number of species reaches a plateau (asymptote) fairly early in the exercise. So you don’t need to count all of them, maybe just 100.
In our case, this statistical method is adapted to understand how much field variability can be captured by the soil samples with increasing sampling density.
The field variability can be indexed by the 95% range and variance of different soil chemical properties.
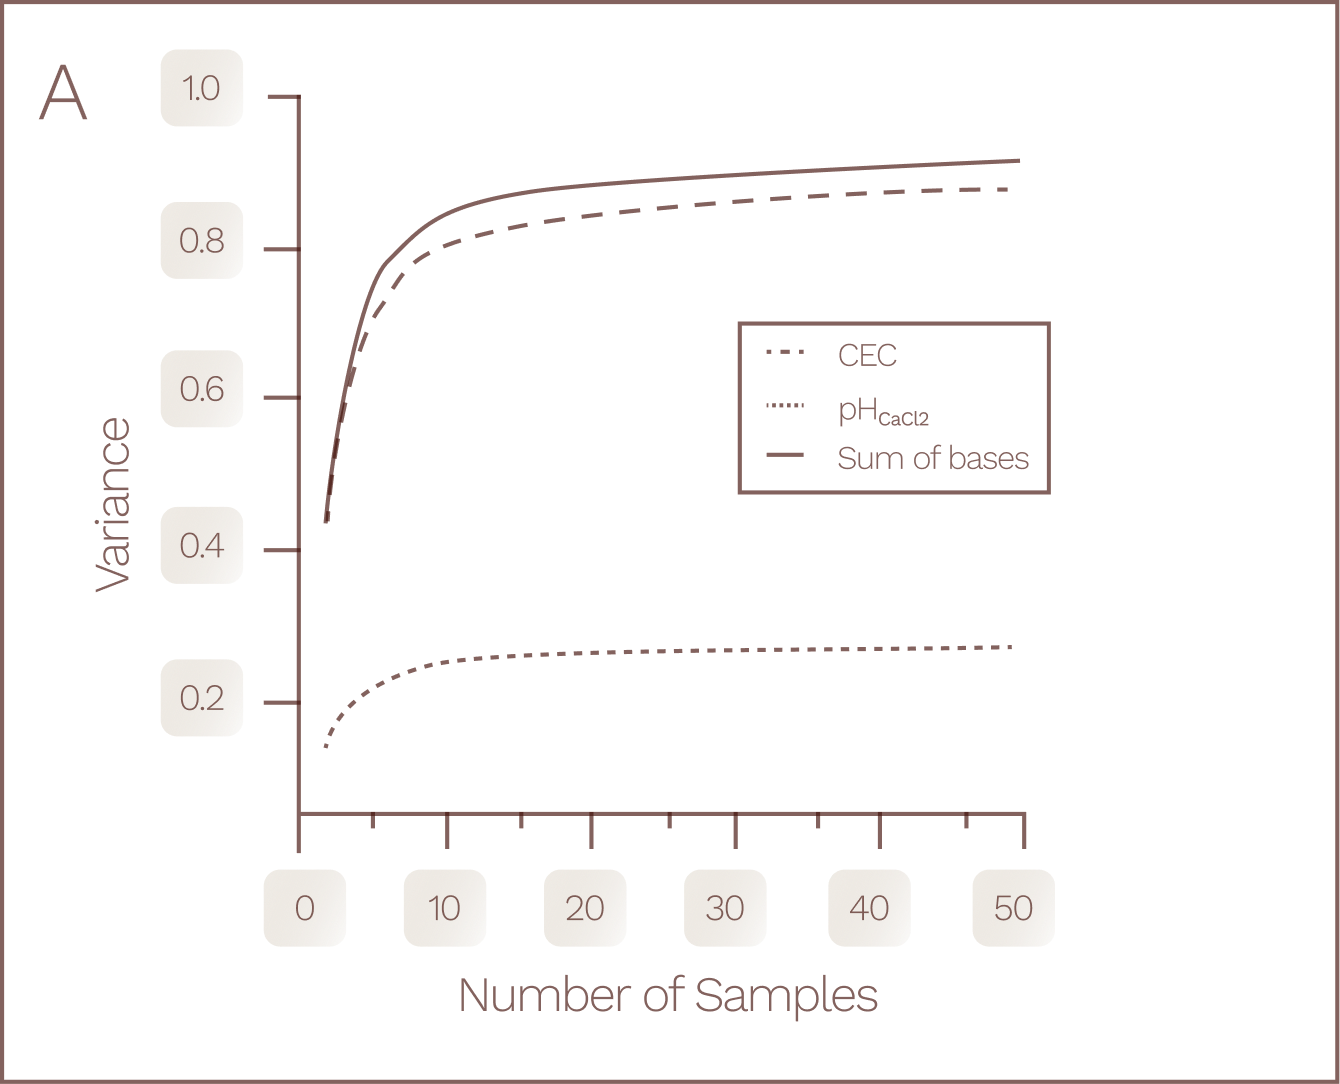
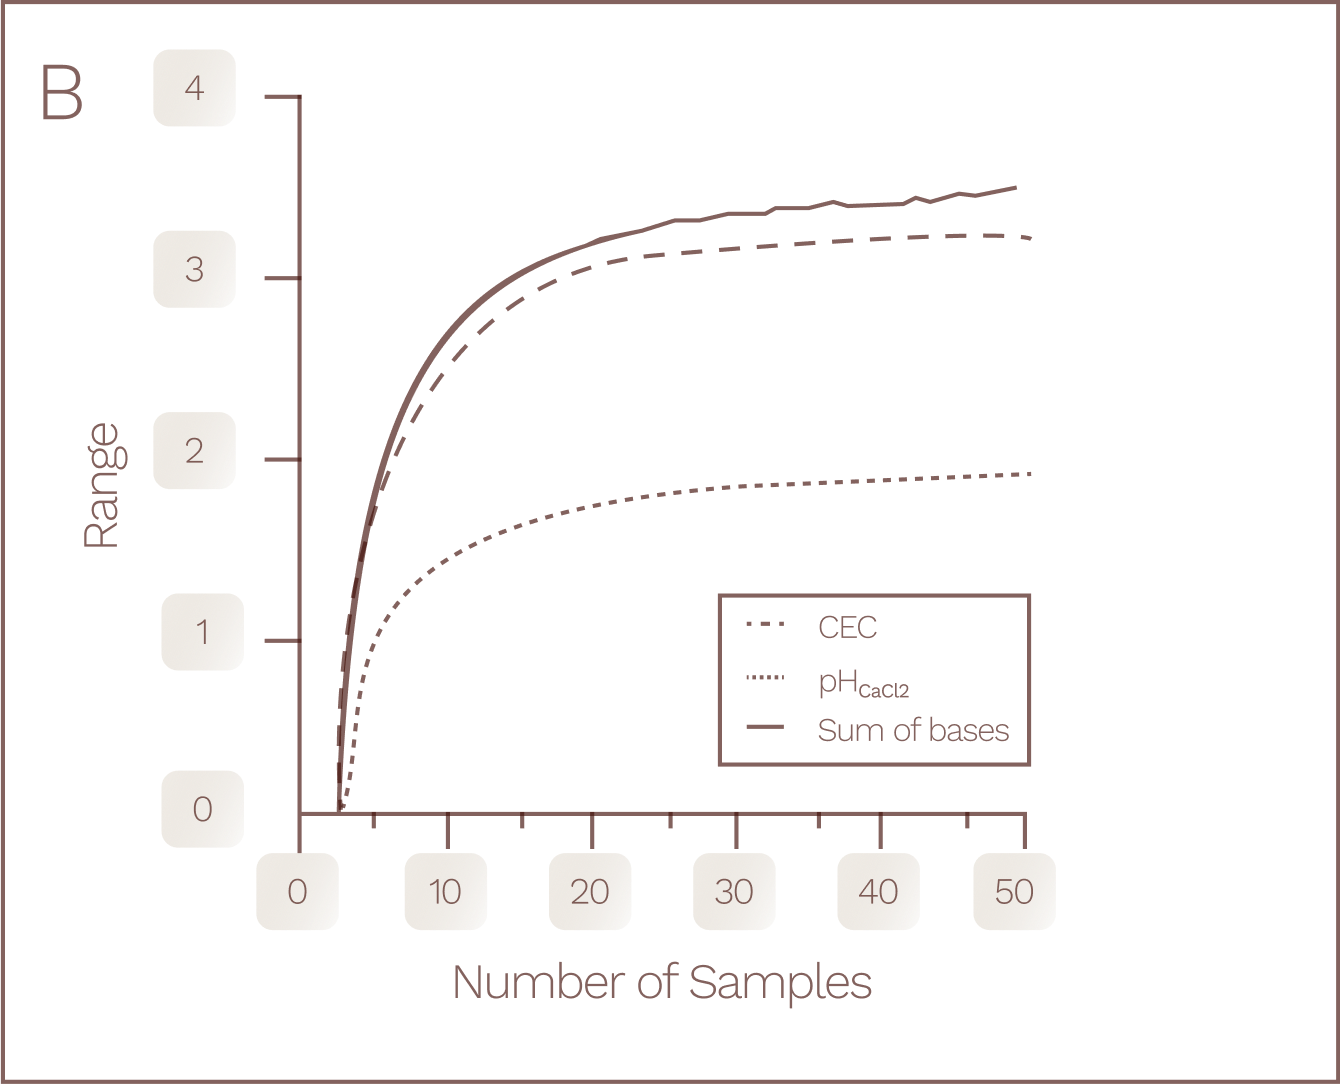
For our recent credit issuance of Project Serra da Mantiqueira, rarefaction analysis of baseline agronomic data supplied by the farmer at roughly 1 sample per 4 hectares reaches asymptotic results in both sampling variance and 95% range after approximately 30 samples, supporting our sampling density at about 1 sample per 20 hectares (Fig. 2A-B).

Fig. 2
Rarefaction analysis of baseline soil agronomic properties (A-B, data supplied by the farm, ~650 hectares with a sampling density of 1 per 4 ha) and post weathering soil total chemistry for treatment sites (C-D, 539.21 hectares (unreformed area only) with a sampling density of 1 per 3 ha, newly collected samples at the end of reporting period were pooled at ~8:1 for analysis), suggesting the sampling density is enough to capture the variance in the field. The field variability is indexed by the 95% range and variance of different soil chemical properties.
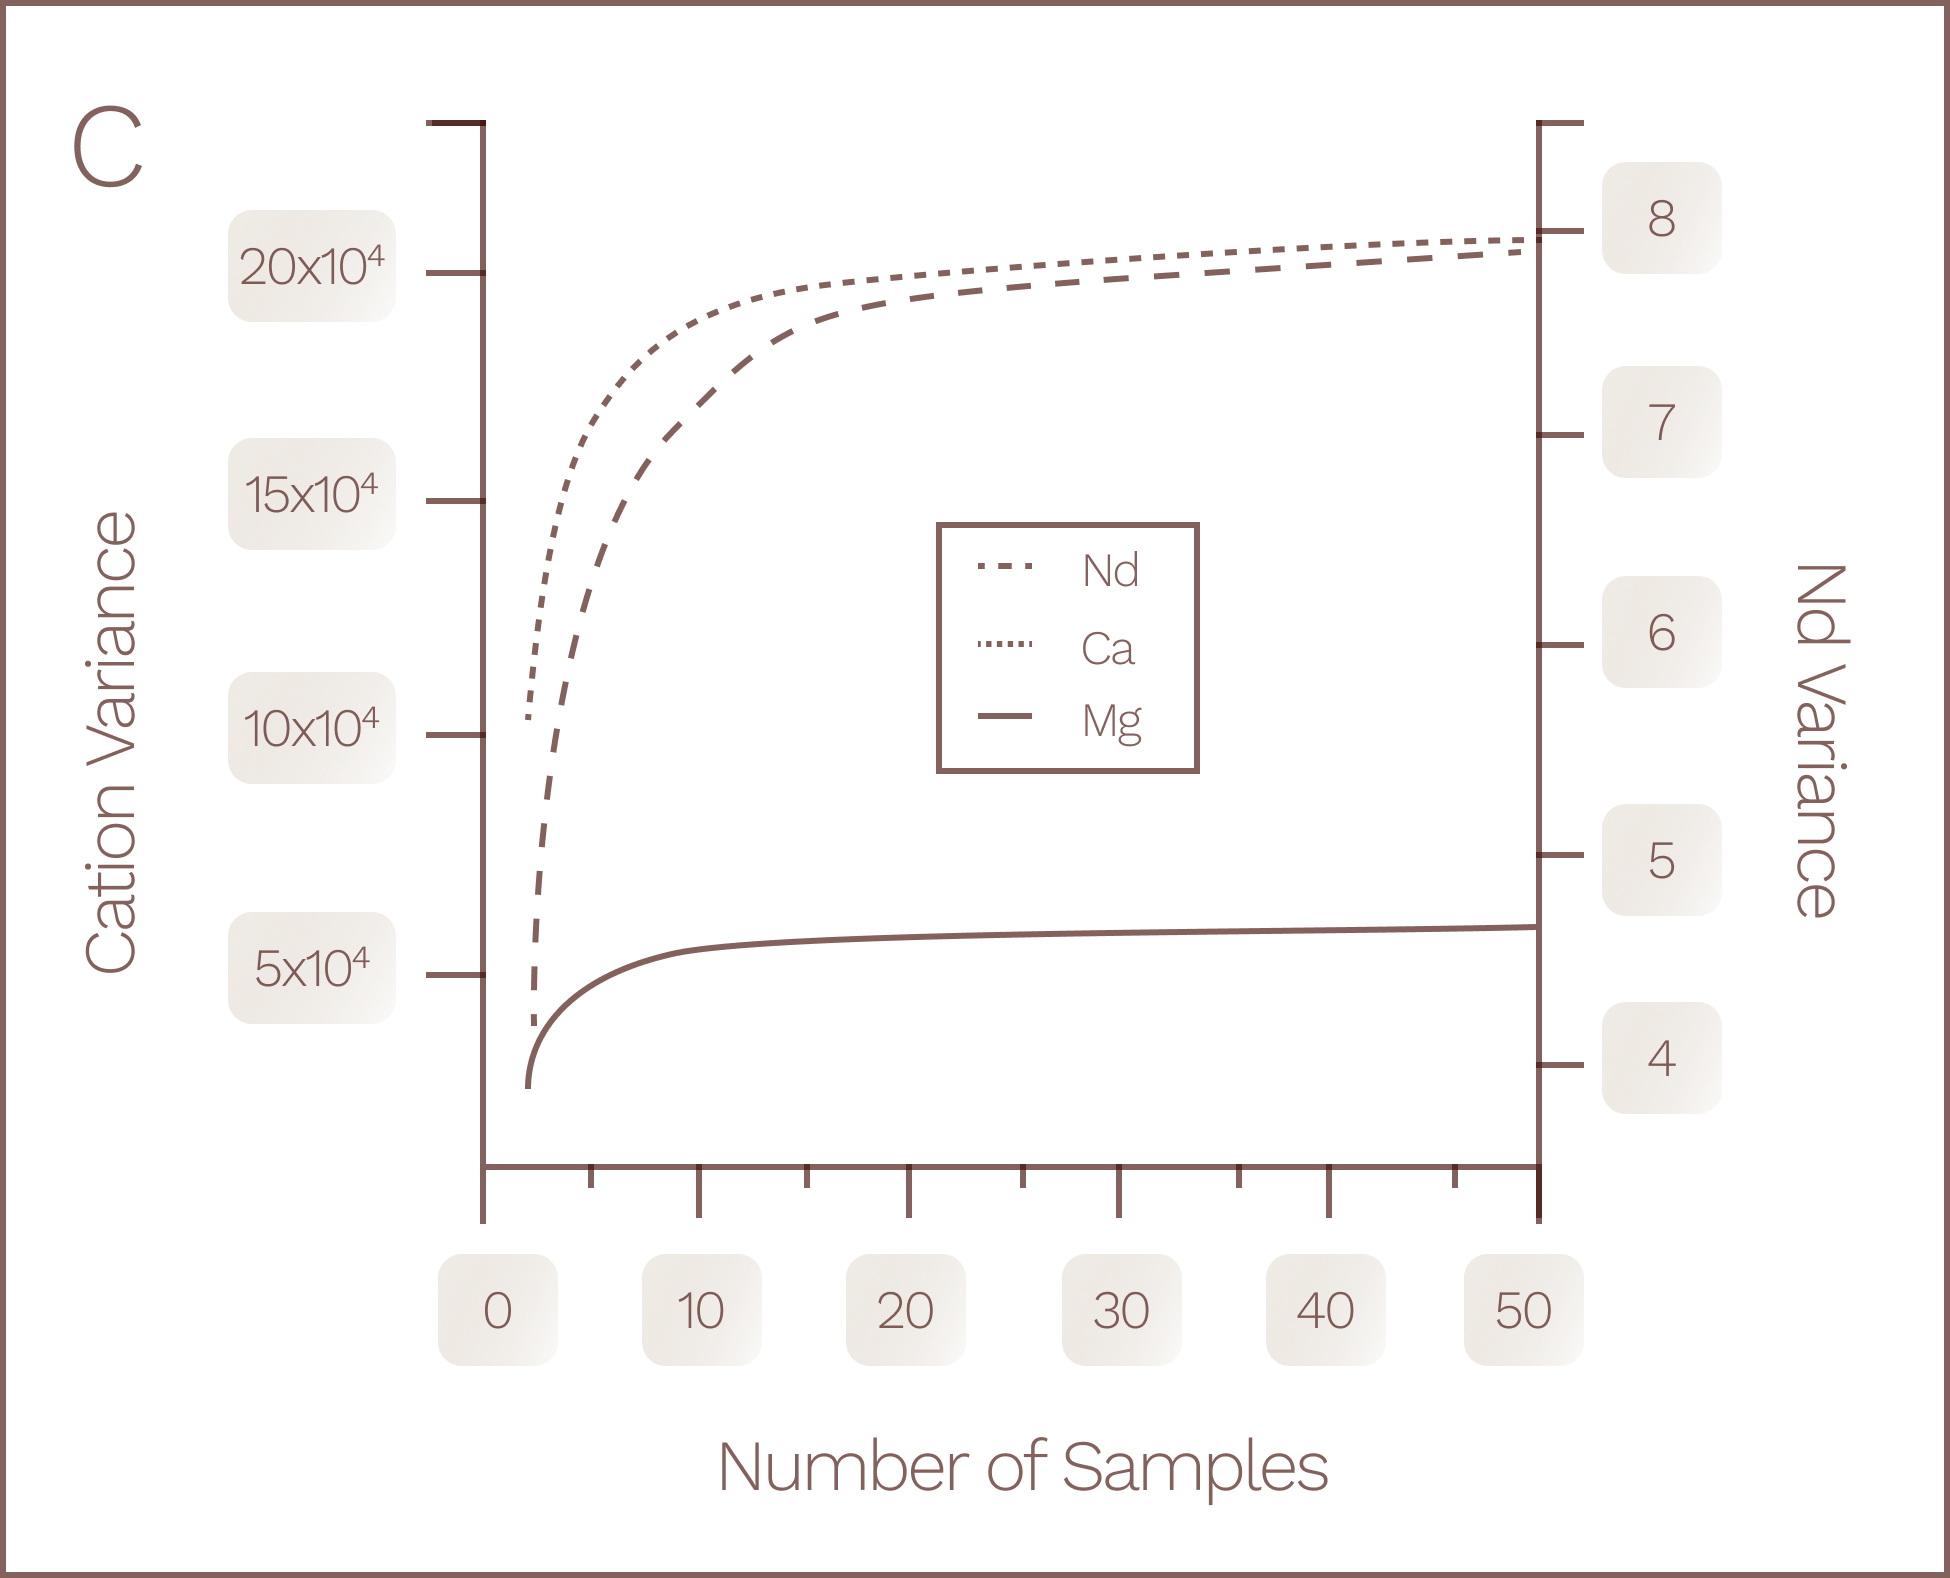
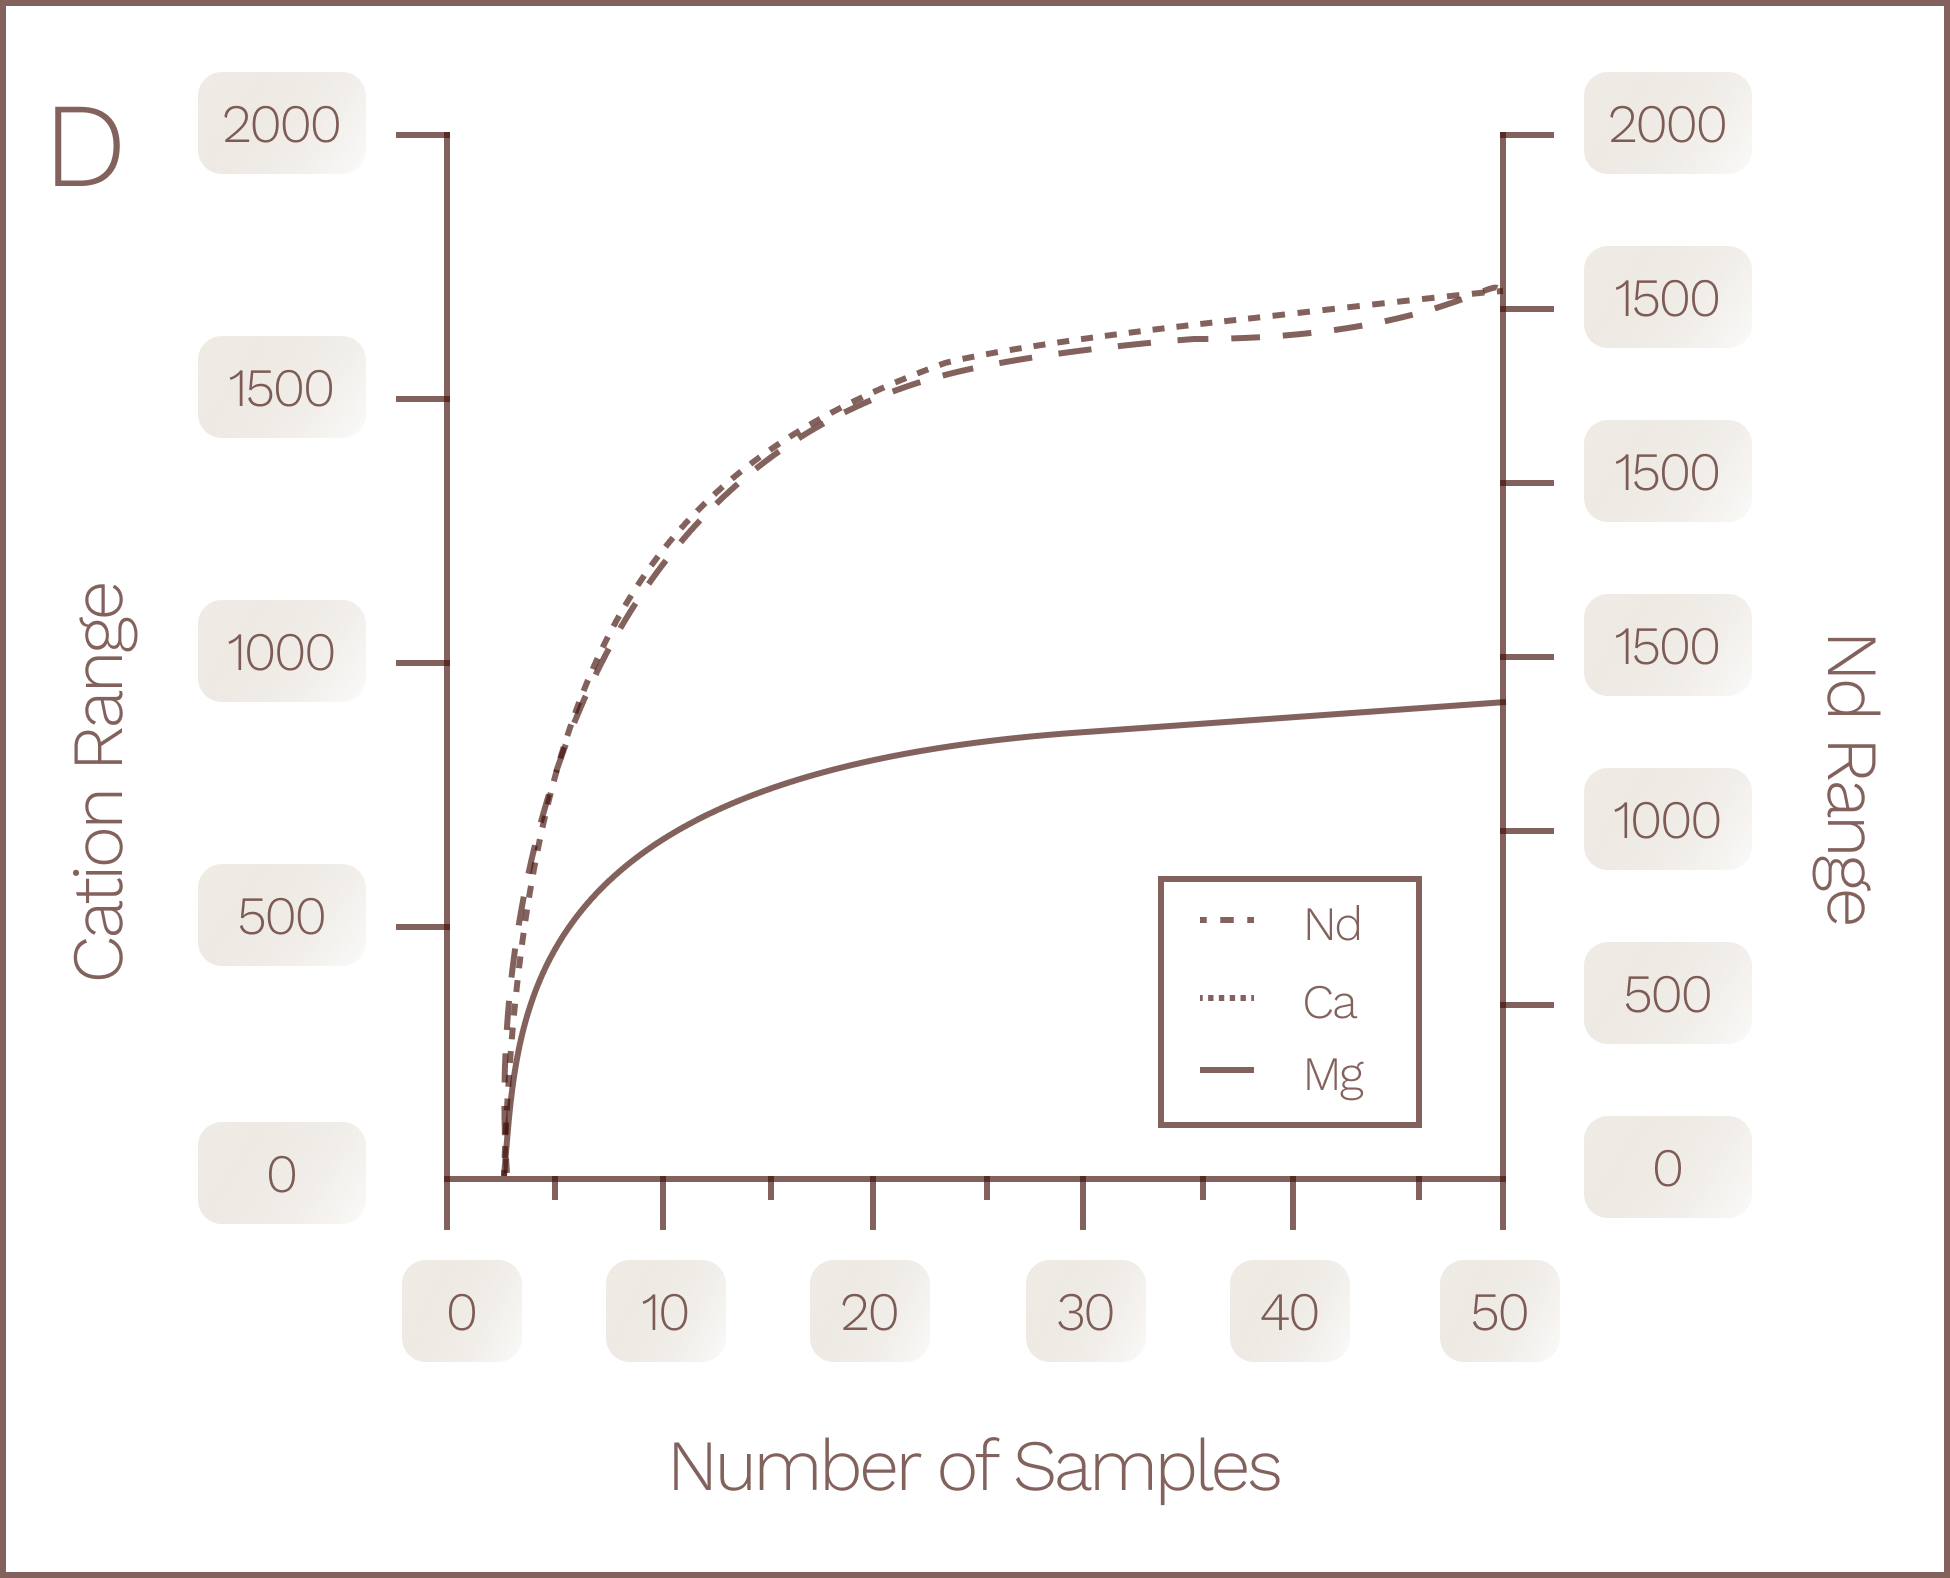
To further validate our choice of sampling density for soil elemental composition, we analyzed the post-weathering soil with a higher sampling density at 1 sample per 3 hectares (Fig. 3) for total chemistry metrics. The rarefaction curves plateau before reaching 20 samples (Fig. 2C-D), confirming that the current sampling density of the project is sufficient to capture the field variance of both agronomic properties and elemental compositions.
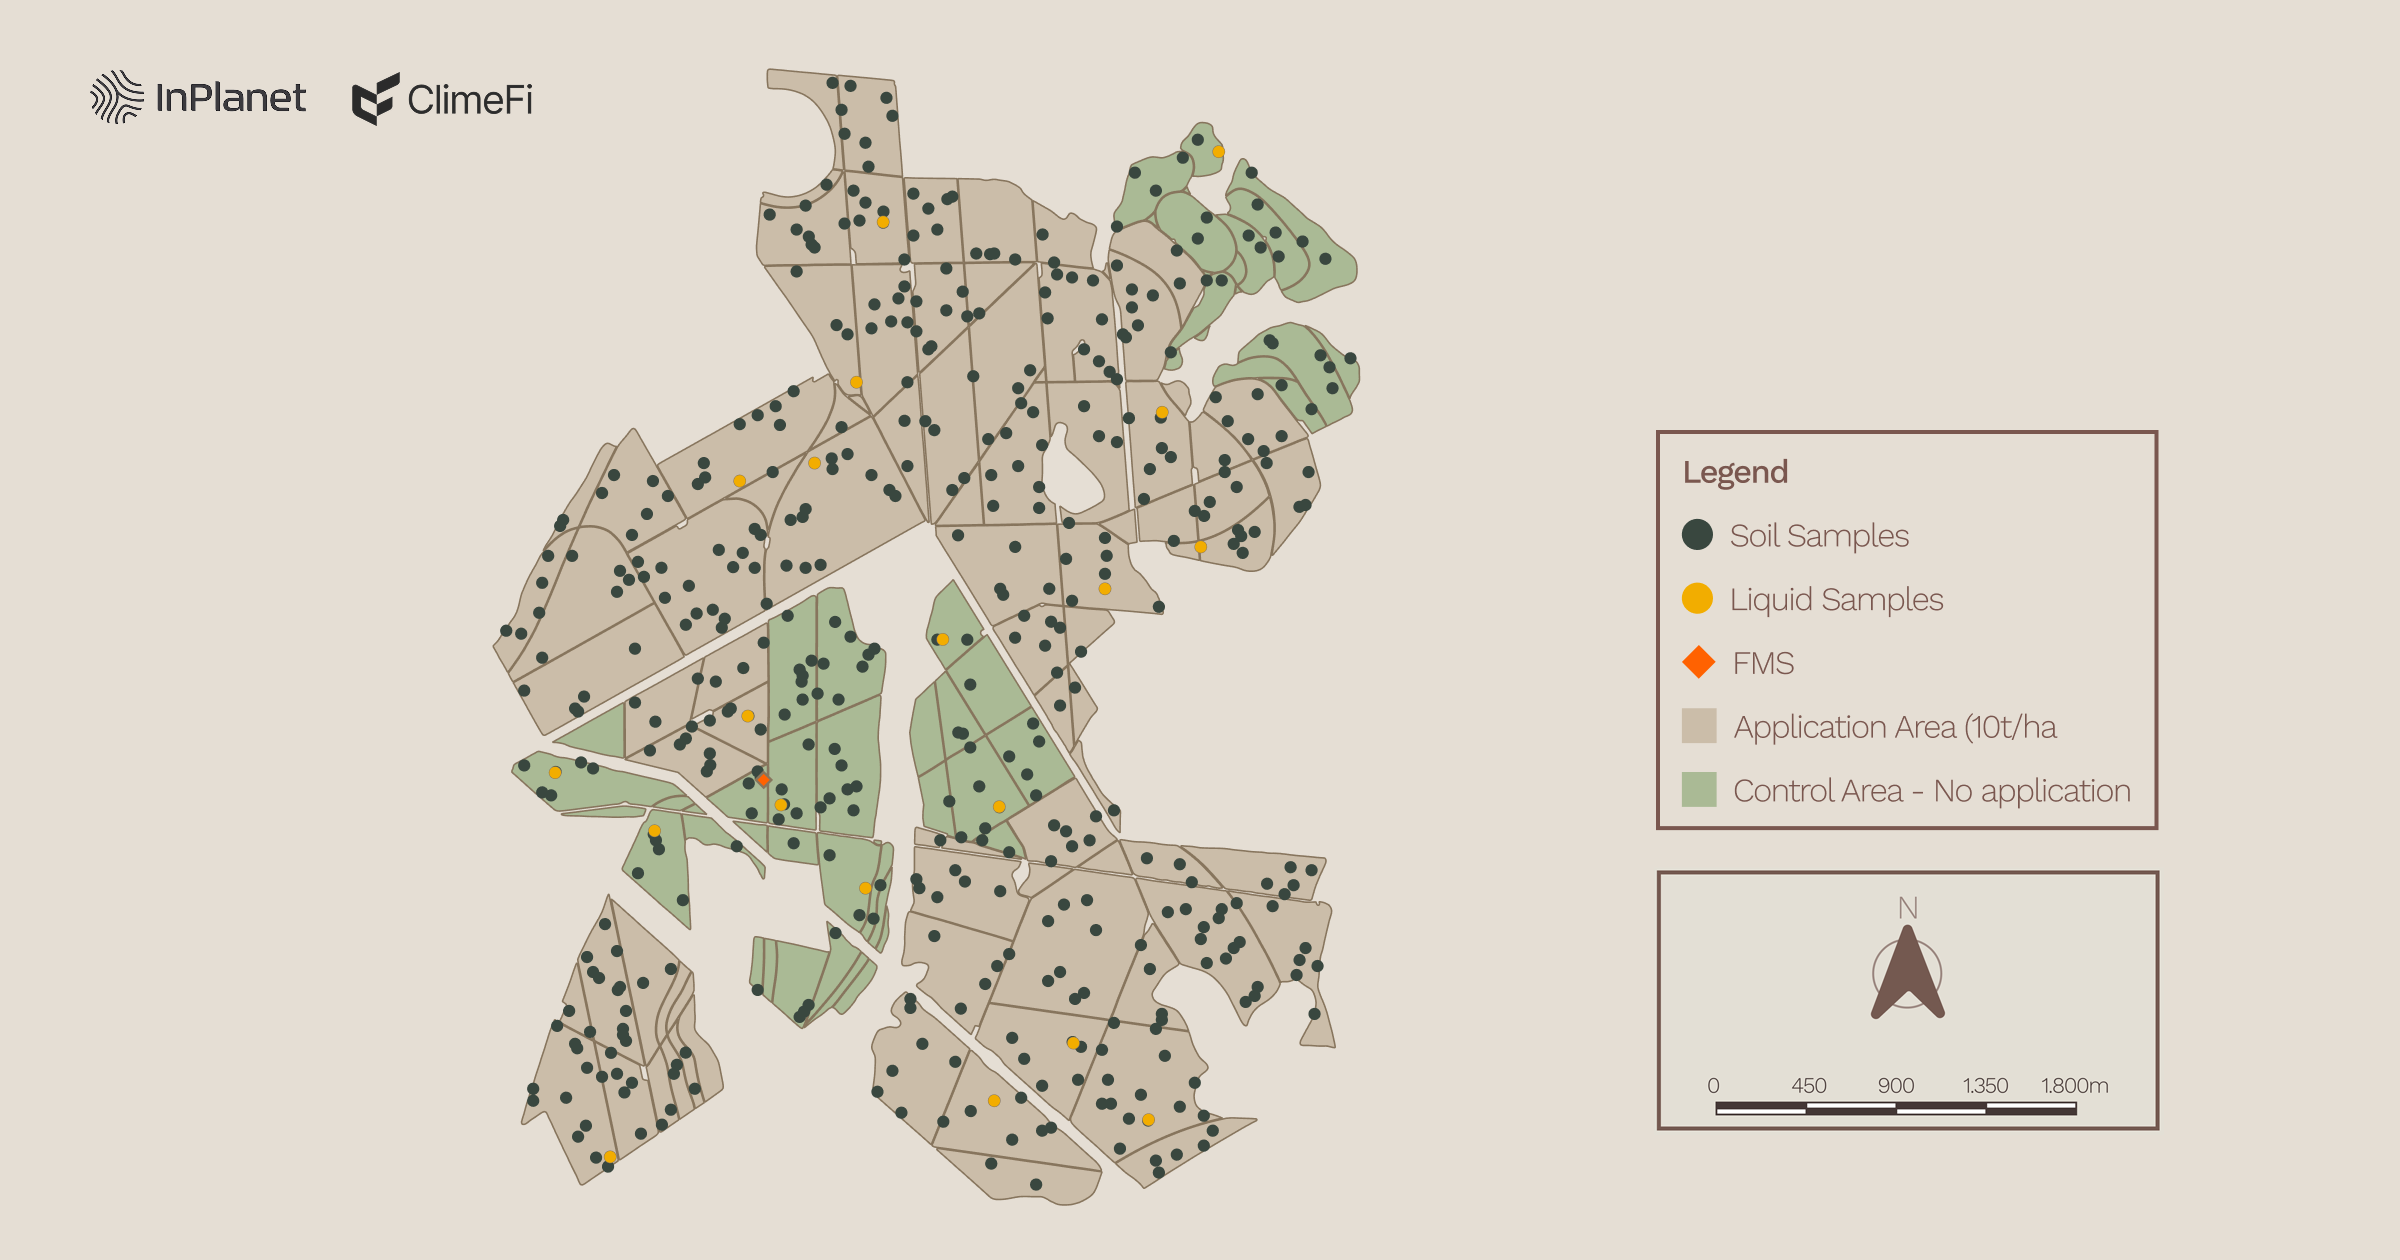
It is noteworthy that Project Serra da Mantiqueira was initiated before the publication of Isometric ERW protocol, and the lower sampling density for this project may not be suitable for other ERW deployments. The low variability of the soil in this case is likely due to the fact that the soils are sandy textured, dominated by quartz (~80%) with low clay (~19%) and organic carbon content (0.64-0.87 wt%), and so are chemically less reactive with lower metals and major elemental concentrations compared to other soils. At InPlanet, we now generally have a default deployment of high sampling density but still undertake rarefaction analysis. This allows us to learn more effectively about sampling strategies and soil heterogeneity in different environments.
Internal consistency for validation
Besides rarefaction analysis, independent data sources can be used to assess whether our sampling plan is representative of field-scale variability. For example, we can compare the feedstock application rate calculated using soil tracer measurements with the application rate recorded in the operational logs.
The immobile tracer approach calculates how much rock powder was added to the soil based on certain elements analysed. These elements, known as immobile tracers, remain in the soil even after the rock powder dissolves.
For Project Serra da Mantiqueira, the mean application rate is 1066.11 g/m2 based on immobile tracer measurements (Fig. 4). This estimation agrees with the value reported in the operational log (1064.56 g/m2), which independently suggests that the project sampling plan is representative enough to capture the heterogeneity of immobile tracer concentration change and characterize the weathering process in the field.
At InPlanet, we will continue to integrate these essential ERW research questions into current and future deployments to refine these MRV approaches. We are also committed to transparency in sharing our findings to enable the field of ERW as a whole.

Fig. 4
Feedstock application rate calculated using the immobile tracer mass balance (i.e., Nd) and bootstrapping estimation. The feedstock application rate recorded in the operational log book is 1064.56 g/m2

References:
Bradford, M.A., Eash, L., Polussa, A., Jevon, F.V., Kuebbing, S.E., Hammac, W.A., Rosenzweig, S. and Oldfield, E.E., 2023. Testing the feasibility of quantifying change in agricultural soil carbon stocks through empirical sampling. Geoderma, 440, p.116719.
von Haden, A.C., Sanford, G.R., Cates, A.M. and Jackson, R.D., 2024. Paired resampling to detect field-level soil organic carbon stock change. Comment on “Testing the feasibility of quantifying change in agricultural soil carbon stocks through empirical sampling” by Bradford et al. Geoderma, 448, p.116959.
Chernick, M.R., 2011. Bootstrap methods: A guide for practitioners and researchers. John Wiley & Sons.
Authored by:
Dr. Matthew Clarkson
Head of Carbon
Dr. Junyao Kang
Data Analysis & Modeling Lead
Dr. Christina Larkin
Head of Science & Research
Reviewed by:
Dr. Kevin Sutherland
Carbon Removal Scientist at
Isometric
Dr. Ella Holme
Head of Mineralization Science at Isometric